Plots
Plugin for improving sail trim and maintaining course
Links
-
Maintainance Source: https://github.com/rgleason/plots_pi
-
Download: Downloads
-
Forum: CF Plots_pi Thread
-
YouTube Sean: Plots Plugin
Plots Plugin has been improved again, and provides Historical data in a format useful for sailing, using a large selection of Data Types (Speed, Course, Wind True & Apparent, etc). It is the best tool for showing historical data in OpenCPN.
Installation
The OpenCPN Manual has general information in Plugin Download, Install and Enable.
Purpose
The plugin is designed to monitor speed and course to make the changes to sail sweep obvious. It may be used to better understand the sailing characteristics of a particular sailing vessel, or for fine tuning to give optimal results.
For example, tightening a vang, adjusting the the traveler or the jib may produce such a slight change that it is difficult to gauge the result. This plugin can make gps speed feedback visible.
The predictor line allows setting the sample time for smoother prediction than the builtin predictor. This is especially useful when traveling relatively slowly in areas with large waves.
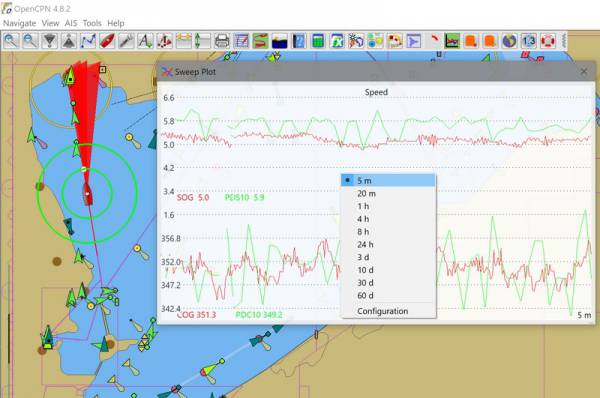
The top histogram is the Speed Screen which offers Speed, PDS10 (Position Determined Speed = 10 seconds) and PDS 60 (60 seconds.)
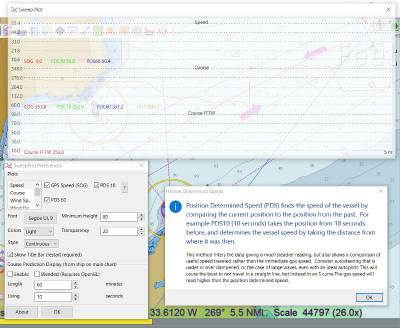
PDS
Position Determined Speed PDS finds the speed of the vessel by comparing current position to the position from the past. For example PDS10 (10 seconds) takes the position 10 seconds before and determines the vessel speed by taking the distance from where it was then.
This method filters the data, giving a much steadier reading, but also shows a comparison of useful speed traveled rather than the immediate GPS speed. Consider autosteering that is over or under dampened, or the case of large waves, even with an ideal autopilot. This will cause the boat to not travel in a straight line, but in a S curve. The GPS speed with read higher than the PDS position determined speed.
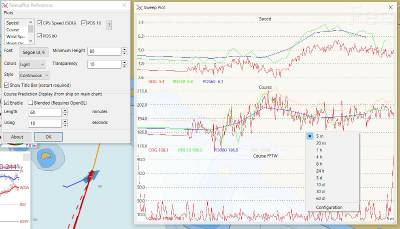
Configuration
While running the plugin right-click on the plugin screen to bring up the Configuration Menu.
While using the plugin you an right-click to change various settings on the fly.
Time Frame to Display Select a time frame for the Display from 5 minutes to 60 days.
Transparency The value 1 is fully opaque. The value 100% is fully transparent. Do not use this value, the plugin will be lost and the Transparency setting can only be changed from the Sweepplot setting in the opencpn.ini file. Look for
 [Settings/Plots]
   PlotTransparency=7
in order to reset the transparency to something that can be seen.
| Changes in Transparency value do not show until the PI Toolbar button is toggled. |
This is one of Sean’s plugins.