Simple histogram instrument
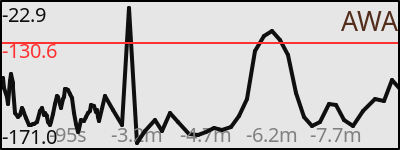
A resctangular instrument displaying a single numerical value history. Allows to select formatting and unit conversion from the SI units used by Signal K to usual units used in navigation as well as the length of the history shown by the instrument.
| Parameter | Description | Example | ||||
|---|---|---|---|---|---|---|
Name |
Name of the instrument |
Time from primary GPS |
||||
Title |
Title of the instrument to be displayed |
GPS Time |
||||
Timeout |
Timeout in seconds. If the set numeber of seconds passes since the last update for the Signal K key displayed by the instrument pass without receiving an update, the value is considerd timed out and is replaced by dashes. |
3 |
||||
SK key |
Fully qualified Signal K path to the value displayed by the instrument |
vessels.urn:mrn:signalk:uuid:76bb2350-c92e-4e47-b3c3-e12273f21155.environment.depth.belowTransducer |
||||
Format |
Format of the displayed number. Supported formats
|
|||||
Transformation |
Function to be used to convert the value from the SI unit used by Signal K to human readable form Supported transformation functions
|
|||||
Order |
Order of values in the graph
|
|||||
History |
Length of the history shown by the instrument. Selectable between 1 minute and 3 days.
The data with different resolution are seamlessly combined together for longer time ranges. |
5 minutes |
||||
Instrument width |
Width of the instrument on screen |
200 |
||||
Instrument height |
Height of the instrument on screen |
200 |
||||
Title color |
Color of the instrument title in upper right corner |
|||||
Graph color |
Color of the graph line and Y-axis labels |
|||||
Mean color |
Color of the dynamically calculated mean value line and label |
|||||
Time color |
Color of the bottom labels for time |
|||||
Border color |
Color of the border of the instrument |